Market | Taiwan
Current risk Level

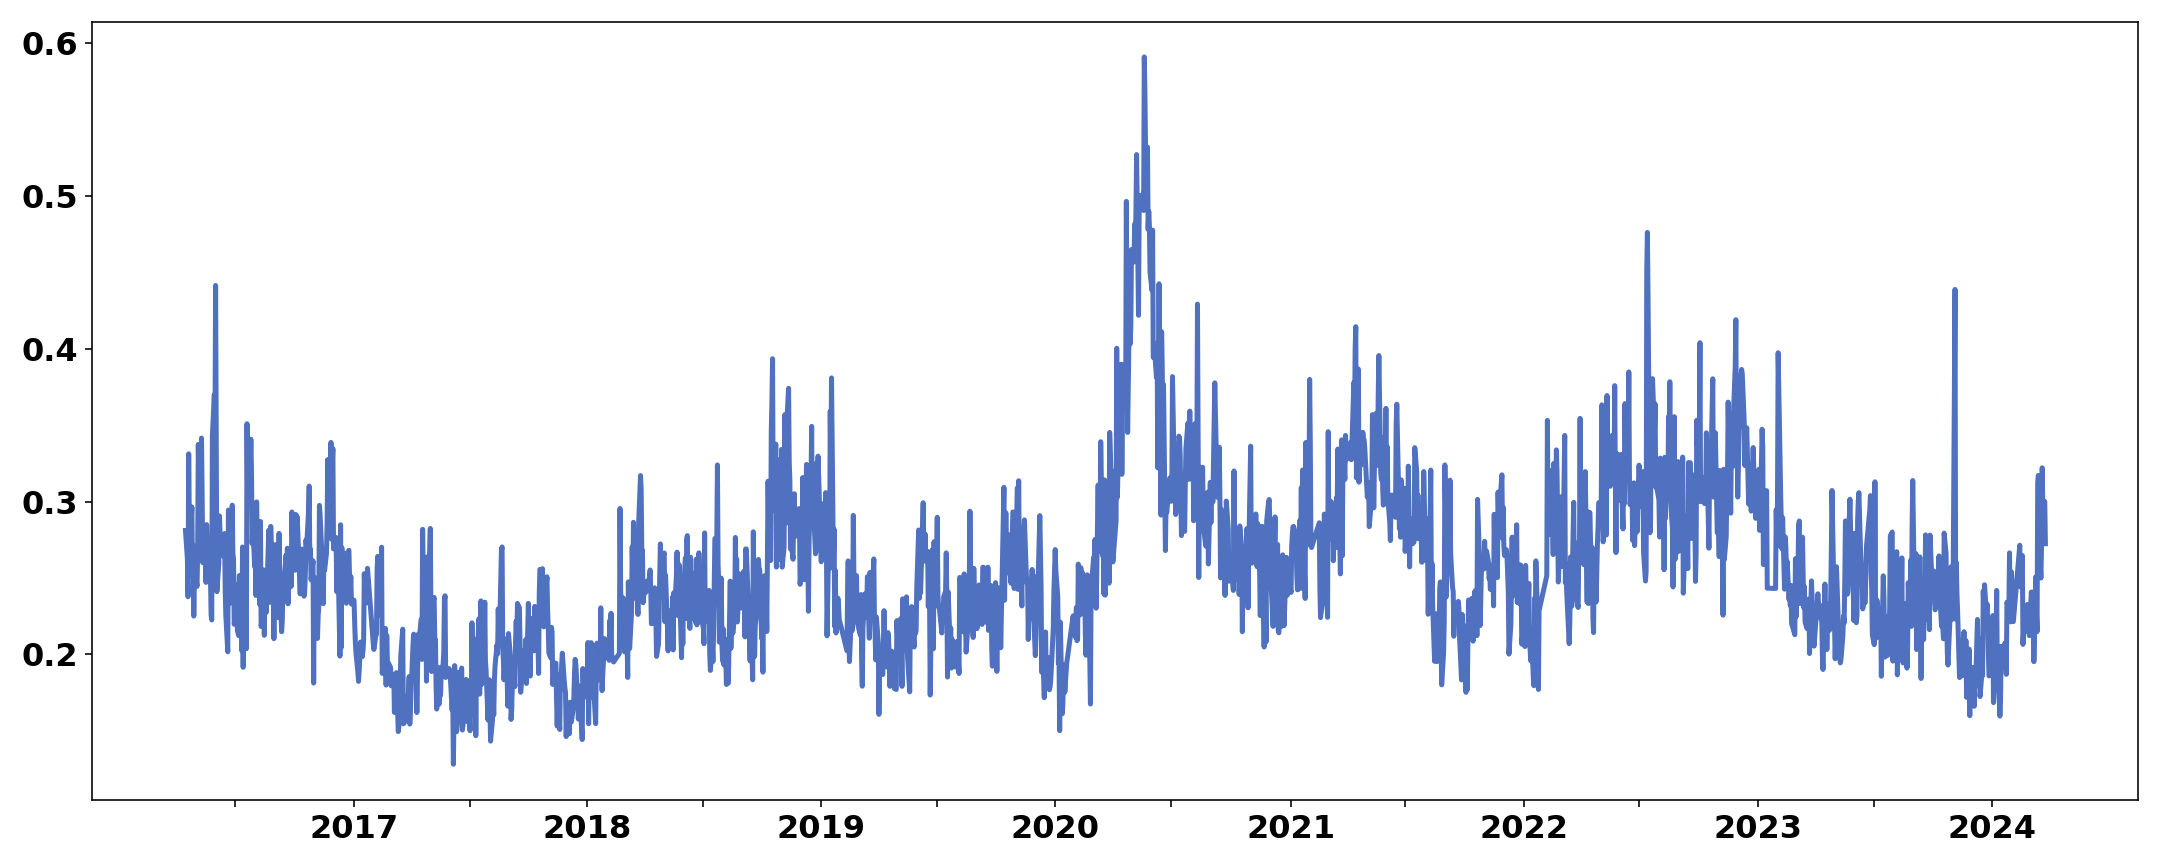
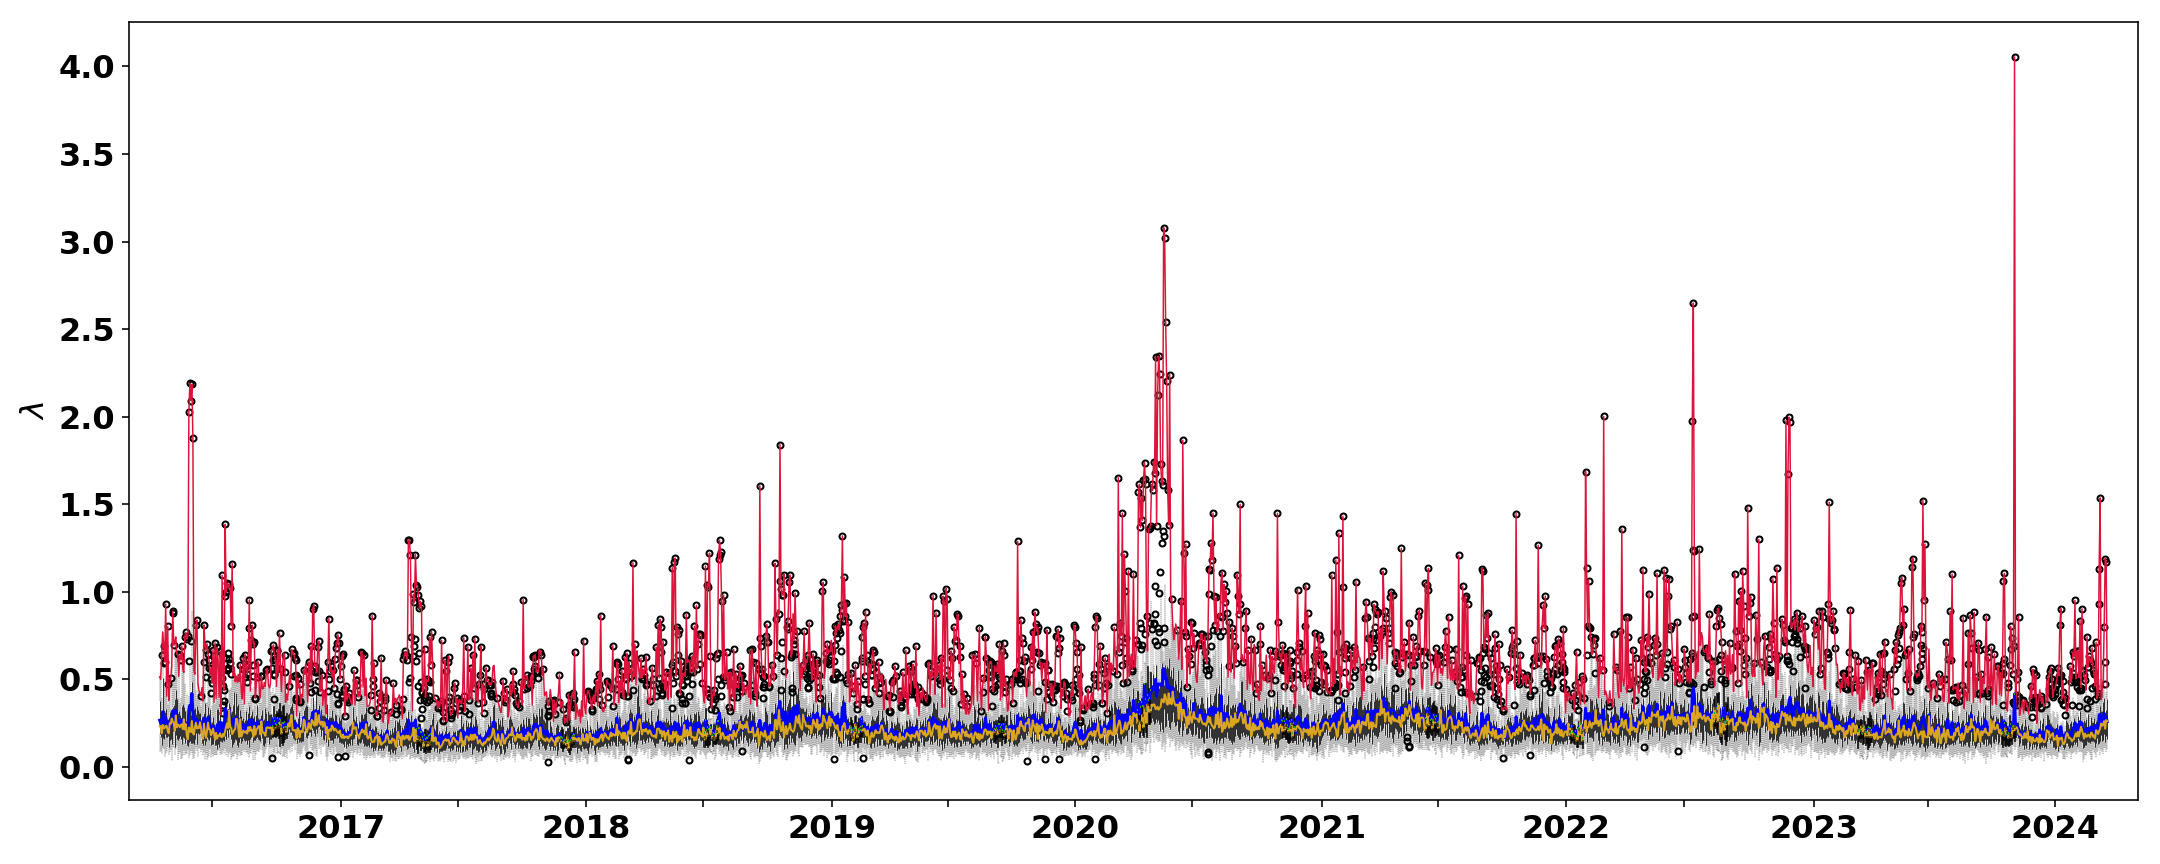
Orange: high risk of crisis in the financial market. A crisis might occur very soon. This risk level is given for lambda values between the 60%-ratio and 80%-ratio. (Updated Mar.2024)
Timeline
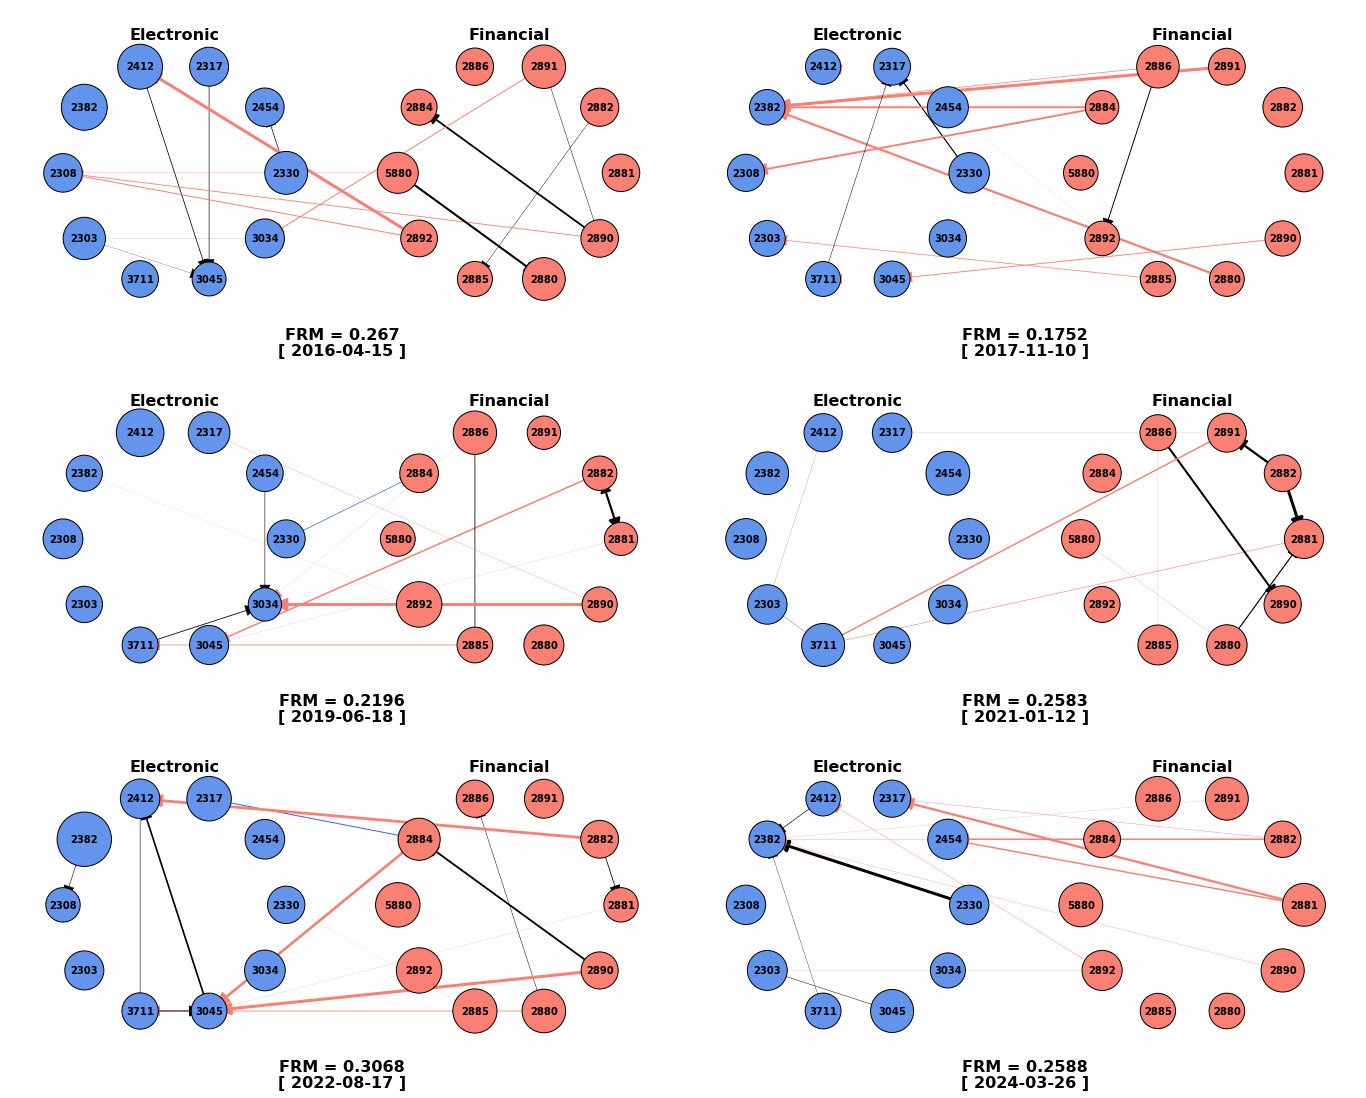
FRM@Taiwan is designed to capture the systemic risk dynamics within Taiwan’s high-cap electronics and financial sectors. It focuses on the top 20 companies by market capitalization within each sector, traded on the Taiwan Stock Exchange.
By analyzing the adjacency matrix, FRM@Taiwan provides insights into the network dynamics, identifying key players so called high co-stress company and their interrelations within these critical sectors.
What This Is About:
The Financial Risk Meter (FRM) is a novel risk measure used to identify different systemic risk levels in the financial markets over time. It is an index of the system volatility level, thus if FRM is high, then the systemic risk is also high.

Details:
We propose a linear lasso measure to estimate systemic interconnectedness across financial institutions based on tail-driven spill-over effects in an ultra-high dimensional framework. Methodologically, we employ a variable selection technique in a time series setting for a linear quantile regression framework with 5% quantile. We can thus include more financial institutions into the analysis, to measure their interdependencies in the distribution tails.
Then FRM is induced from this model which is the averaged tuning parameter lambda from the lasso technique.
Risk Levels Explained

Red: severe risk of a crisis in the financial market. Our risk measure suggests that a financial crisis is imminent or happening right now. This risk level is given for lambda values higher than the 80%-ratio.

Orange: high risk of crisis in the financial market. A crisis might occur very soon. This risk level is given for lambda values between the 60%-ratio and 80%-ratio.

Yellow: elevated risk of crisis in the financial market. The incidence of a crisis is somewhat higher than usual. This risk level is given for lambda values between the 40%-ratio and 60%-ratio.


Blue: general risk of crisis in the financial market. There is no specific risk of a crisis. This risk level is given for lambda values between the 20%-ratio and 40%-ratio.
Green: low risk of crisis in the financial market. The incidence of a crisis is less likely than usual. This risk level is given for lambda values lower then the 20%-ratio.
NFT Art
What are NFTs? NFTs are Digital tokens that provides proof of ownership and authenticity for assets.
What do they change? They are a new and fast way of digital art trading, see for example collections such as CryptoPunks, Art Blocks, etc.

NFT Art Market
- Initial sale and price determined by the creator
- Most trades occur on platforms like Opensea and Rarible
- Subsequent transactions are traceable
Conventional Art Market
- Creators in traditional art markets rely on dealers/galleries for sales
- Prices are determined through valuation and negotiation
References
Ideas, papers, theory and code used in this project:
Financial Risk Meter For The Romanian Stock Market (2023)
Romanian Journal of Economic Forecasting
Pele DT, Conda AL, Bag RC, Mazurencu-Marinescu-Pele M, Strat VA
Applied Economics, Systemic Risk and Financial System Network using Financial Risk Meter: The Case of Vietnam (2023)
Applied Economics
Nguyen PA, Nguyen NP, Le HMD
Assessing Network Risk with FRM: Links with Pricing Kernel Volatility and Application to Cryptocurrencies (2023)
Quantitative Finance
Wang R, Potì V, Härdle WK
A Financial Risk Meter for China (2023)
Emerging Markets Review
Wang R, Althof M, Härdle WK
Financial Risk Meters in Taiwan, Working Paper (2023)
Teng HW, Jheng SL, Chen JY, Tang CY, Tsai HY, Härdle WK
Financial Risk Meter FRM based on Expectiles (2022)
Journal of Multivariate Analysis
Ren R, Lu MJ, Li Y, Härdle WK
Financial Risk Meter for Cryptocurrencies and Tail-Risk Network Based Portfolio Construction (2022)
The Singapore Economic Review
Ren R, Althof M, Härdle WK
Financial Risk Meter for emerging markets (2022)
Research in International Business and Finance
Amor SB, Althof M, Härdle WK
FRM Financial Risk Meter (2020)
The Econometrics of Networks
Mihoci A, Althof M, Chen CYH, Härdle WK
An AI approach to Measuring Financial Risk (2020)
Singapore Economic Review
Yu L, Härdle WK, Borke L, Benschop T
LASSO-Driven Inference in Time and Space (2021)
The Annals of Statistics
Chernozhukov V, Härdle WK, Huang C, Wang W
Single-index-based CoVaR with Very High-Dimensional Covariates (2018)
Journal of Business & Economic Statistics
Fan Y, Härdle WK, Wang W, Zhu L
TENET: Tail-Event driven NETwork risk (2016)
Journal of Econometrics
Wolfgang Karl Härdle, Weining Wang, Lining Yu
