Market | Romania

Current risk Level

Blue: general risk of crisis in the financial market. There is no specific risk of a crisis. This risk level is given for lambda values between the 20%-ratio and 40%-ratio. (Updated May 2024)

Timeline

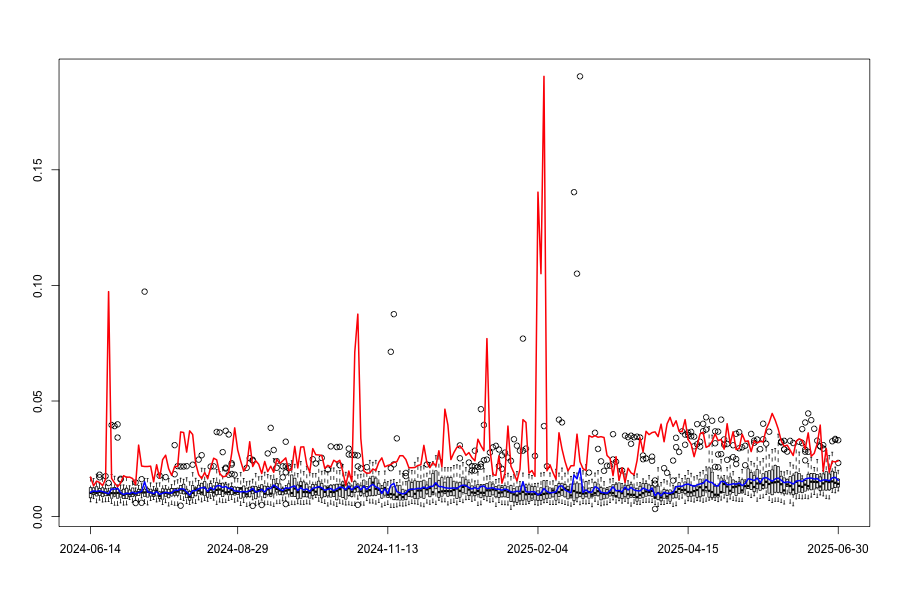
FRM@RO captures the systemic tail event behavior in the Romanian Stock Market, focusing on the most important companies traded at Bucharest Stock Exchange. FRM@RO can properly predict the technical recession between 2009Q1-2009Q2 and 2010Q3, as shown by high values of estimated probabilities. Furthermore, the model gives a signal of potential risk to the economy in 2020Q2 when the Romanian real quarterly GDP (seasonally adjusted) decreased by 11.17%. Although it was not a case of technical recession (two consecutive quarters of quarter-on-quarter GDP contraction), the value of FRM@RO in the first quarter of 2020 can be seen as an early warning indicator of economic contraction in the second quarter of 2020, due to the Covid-19 pandemic.

Using the adjacency matrix, we can describe the network behavior and co-movements between the companies listed at BSE (Bucharest Stock Exchange), as seen in the image below.

What This Is About:

The Financial Risk Meter (FRM) is a novel risk measure used to identify different systemic risk levels in the financial markets over time. It is an index of the system volatility level, thus if FRM is high, then the systemic risk is also high.

Details:

We propose a linear lasso measure to estimate systemic interconnectedness across financial institutions based on tail-driven spill-over effects in an ultra-high dimensional framework. Methodologically, we employ a variable selection technique in a time series setting for a linear quantile regression framework with 5% quantile. We can thus include more financial institutions into the analysis, to measure their interdependencies in the distribution tails.

Then FRM is induced from this model which is the averaged tuning parameter lambda from the lasso technique.

Risk Levels Explained

Red: severe risk of a crisis in the financial market. Our risk measure suggests that a financial crisis is imminent or happening right now. This risk level is given for lambda values higher than the 80%-ratio.

Orange: high risk of crisis in the financial market. A crisis might occur very soon. This risk level is given for lambda values between the 60%-ratio and 80%-ratio.

Yellow: elevated risk of crisis in the financial market. The incidence of a crisis is somewhat higher than usual. This risk level is given for lambda values between the 40%-ratio and 60%-ratio.

Blue: general risk of crisis in the financial market. There is no specific risk of a crisis. This risk level is given for lambda values between the 20%-ratio and 40%-ratio.

Green: low risk of crisis in the financial market. The incidence of a crisis is less likely than usual. This risk level is given for lambda values lower then the 20%-ratio.

References

Ideas, papers, theory and code used in this project:

Financial Risk Meter For The Romanian Stock Market (2023)
Romanian Journal of Economic Forecasting
Pele DT, Conda AL, Bag RC, Mazurencu-Marinescu-Pele M, Strat VA

A Financial Risk Meter for China (2023)
Emerging Markets Review
Wang R, Althof M, Härdle WK

Financial Risk Meters in Taiwan, Working Paper (2023)
Teng HW, Jheng SL, Chen JY, Tang CY, Tsai HY, Härdle WK

Financial Risk Meter FRM based on Expectiles (2022)
Journal of Multivariate Analysis
Ren R, Lu MJ, Li Y, Härdle WK

Financial Risk Meter for emerging markets (2022)
Research in International Business and Finance
Amor SB, Althof M, Härdle WK

FRM Financial Risk Meter (2020)
The Econometrics of Networks
Mihoci A, Althof M, Chen CYH, Härdle WK

An AI approach to Measuring Financial Risk (2020)
Singapore Economic Review
Yu L, Härdle WK, Borke L, Benschop T

LASSO-Driven Inference in Time and Space (2021)
The Annals of Statistics
Chernozhukov V, Härdle WK, Huang C, Wang W

Single-index-based CoVaR with Very High-Dimensional Covariates (2018)
Journal of Business & Economic Statistics
Fan Y, Härdle WK, Wang W, Zhu L

TENET: Tail-Event driven NETwork risk (2016)
Journal of Econometrics
Wolfgang Karl Härdle, Weining Wang, Lining Yu